Why we made itwhy we made it
odd duck makes a number of apps and games side by side. The more we made, the more often the same questions came up: how hot does this app make the phone, how much battery does it use, and does it slow down if you leave it running?
Tools to measure performance already existed. But most of them were made for experts: install developer tools on a PC, connect the phone, then read dense graphs and logs yourself.
So we took the measuring tool we built for ourselves and shaped it so that anyone can use it with just a phone, in plain words. That is where Perf Check began.
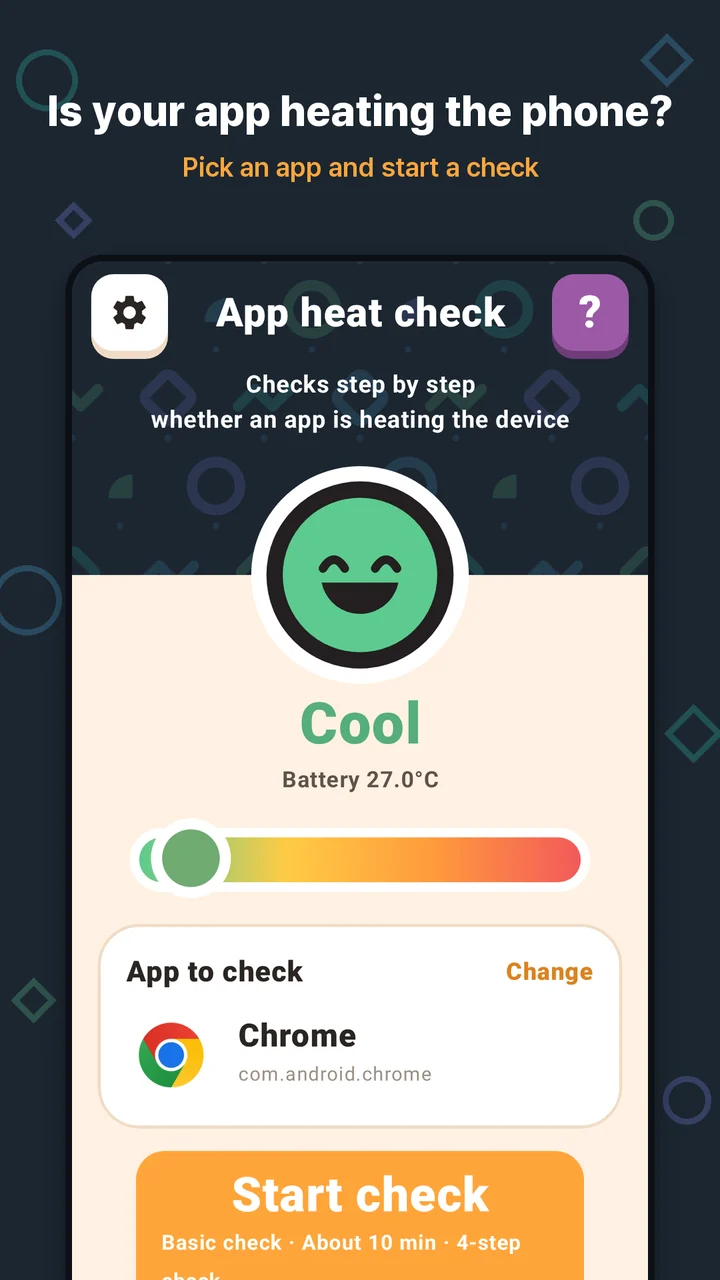
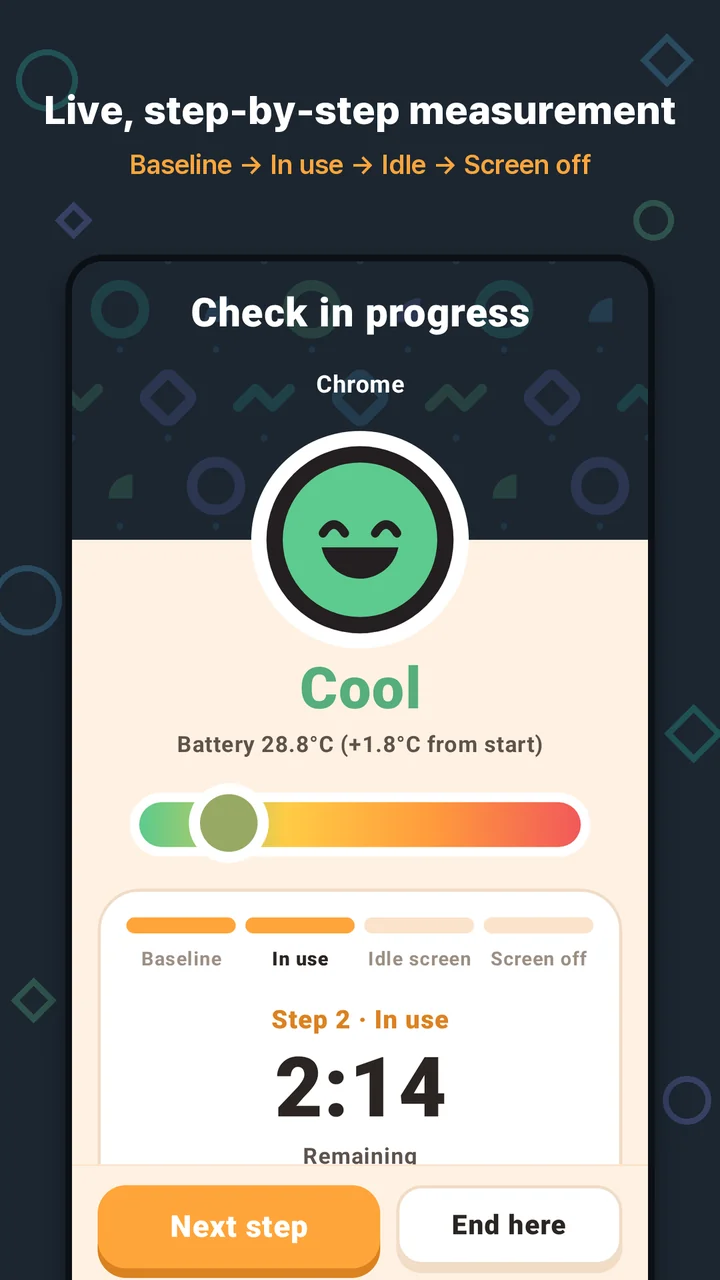 Perf Check
A few scenes of heat and throttlinga few scenes
A phone slows itself down when it gets hot. This is called throttling. Here are a few scenes in which this usually invisible behavior came into view.
On December 28, 2017, Apple apologized for not being clearer that, starting with iOS 10.2.1, it had limited peak performance on iPhones with aging batteries to keep them from shutting down unexpectedly. It also said an update in early 2018 would let people see their battery's health (TechCrunch, December 28, 2017).
Android 10 (2019) added a way for apps to read the device's thermal status. Apps can receive a status split into levels, from ‘no throttling’ up to ‘shutdown’ (Android Open Source Project docs).
In March 2022, the benchmark app Geekbench removed Samsung's Galaxy S22, S21, S20 and S10 series from its performance charts. Its reason: the Game Optimizing Service (GOS) lowered performance app by app, but left benchmark apps alone. Samsung said an update would give users an option to prioritize performance (XDA Developers, March 5, 2022).
Tools for finding the cause have been around for a long time, too. The Android Studio Profiler connects a device and an app to Android Studio on a PC and records CPU, memory and power use (Android Developers docs), and Perfetto, Android's default tracing system, keeps extremely detailed records (Perfetto docs). Both are powerful, but you need a development setup and you need to know how to read the records.
Everyone has felt a phone get hot, but for a long time the tools that measure why lived on developers' PCs. Perf Check brings that measuring onto the phone, in plain words.
One phone, plain wordswhat we changed
Professional tools show you piles of records and graphs. Perf Check chose to measure in detail and explain simply.
- Side by side, on the same phone — Perf Check measures the phone at rest (the baseline) and while the app runs, on the same phone, and works out how much of the extra power, heat and CPU use belongs to that app.
- Four guided steps — Baseline → In use → Idle screen → Screen off. While it measures, a small guide panel floats over the app you are checking, shows the current readings and lets you move to the next step. No root or PC connection needed.
- Causes in plain words — Stays awake with screen off, Nonstop network traffic, Redrawing an unchanged screen, Memory leaks. Each one is rated OK, Watch or Suspect; tap a card to see the numbers behind it and how to fix it.
- One score — Load while in use and the four causes are shown as a score out of 100 with an A–F grade. Check the same app again and the score is compared with the previous run, so you can see right away whether your fix worked.
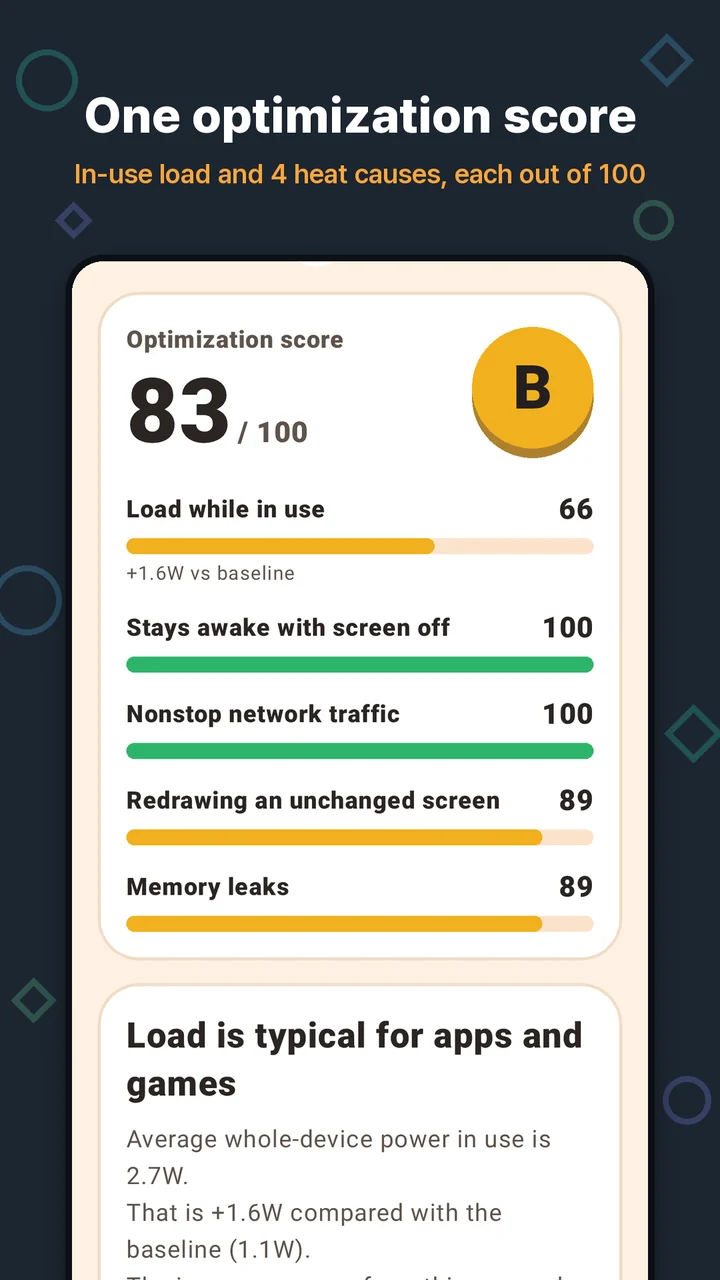
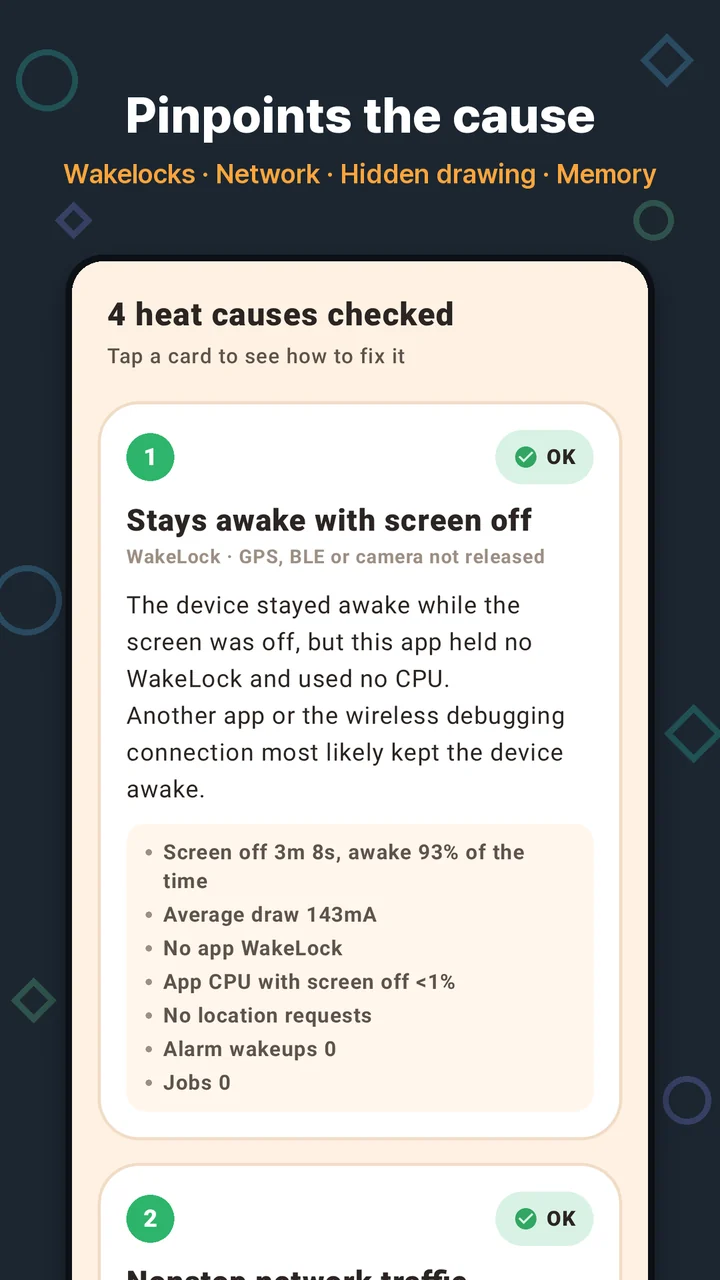 Perf Check
- When you want to dig deeper — On Android 11 and later, Perf Check connects to the phone itself through Wireless debugging in Developer options and measures CPU, threads, FPS and memory for just the app you are checking. There is no other app to install. You can also save the In use step as a Perfetto trace file and keep analyzing it on a PC.
- How well your phone handles heat — The Endurance test in Device test runs every CPU core at full load for a set time and records when, and by how much, performance drops once the hot phone slows itself down. The Quick speed test measures single-core, all-core and memory speed in about 20 seconds.
- Records stay on the phone — Results are saved on the phone, and you can copy a summary or send it by messenger or email to share with your team.
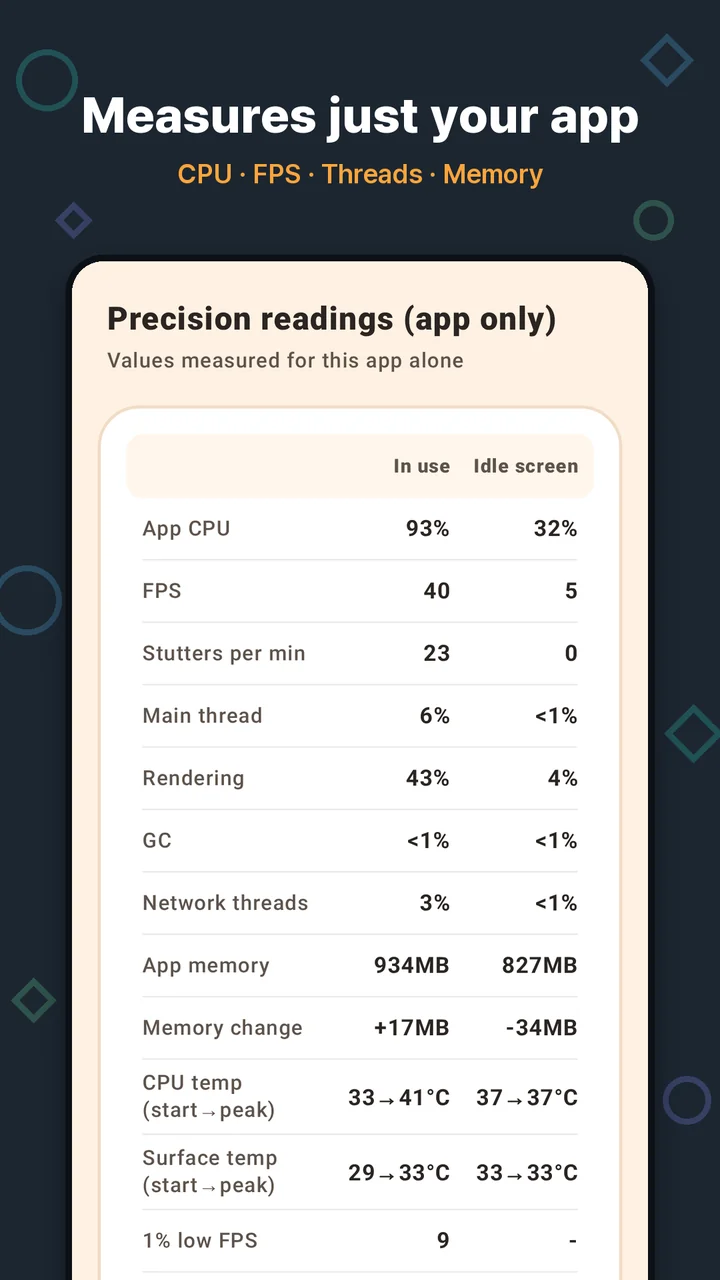
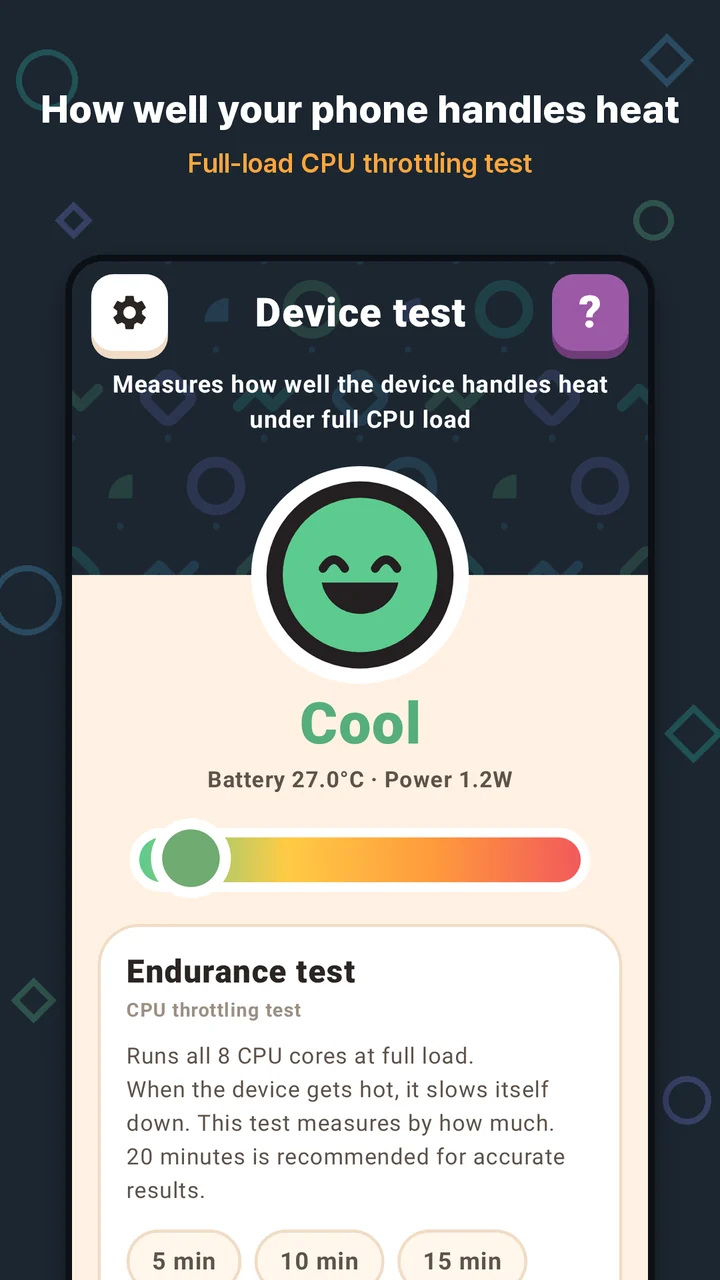 Perf Check
The app's text is available in 11 languages, including Korean, English, Japanese and Chinese (Simplified and Traditional).
When your phone heats up, we hope Perf Check helps you find the reason in numbers instead of guesses, and helps you meet apps that run a little cooler. We hope many people find it easy to use.
How to usehow to use
- Unplug the charger. Power draw is measured accurately with the charger unplugged.
- On the App heat check screen, pick the app to check and tap Start check.
- Baseline — put the phone down on a desk and leave it. When this step ends, the app you are checking opens by itself.
- In use — use the app as usual. You can move to the next step from the guide panel floating on the screen.
- Idle screen — keep the app open and take your hands off it for 1 minute.
- Screen off — press Home and turn the screen off with the power button. Turn the screen back on after 3 minutes or more to see the results.
Sources — Apple apologizes for not telling customers iPhones with older batteries would slow over time (TechCrunch) · Thermal mitigation (Android Open Source Project) · Geekbench accuses Samsung of benchmark manipulation (XDA Developers) · Profile your app performance (Android Developers) · Perfetto docs · App screens: English store screenshots (real measurements)